For a while, I've been wanting to do some at least partially original analysis, and when I noticed that Fan Graphs had an option to export data into Excel files, I figured now was the time. Even with that option, though, it would be extremely time-consuming to collect data for the analyses that I would like to do, so I made do with what I could collect in a reasonable amount of time. What I ended up doing was using batting average on balls in play (BABIP) to predict the players that would have big changes in their results from 2008 to 2009.
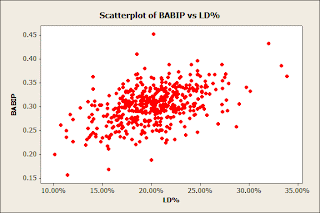
I chose to use all players with at least 100 plate appearances in 2008 for the analysis, which turned out to be 456 players (this includes some doubles who got at least 100 PAs for two teams, but I didn't feel like sorting them out). To start, I compared Line Drive % (LD%) with BABIP. Here's the scatterplot:

There's clearly a positive association here. When running a regression of BABIP on LD%, the P-value comes out to be zero, which confirms what we saw in the scatterplot, but the R-squared value is only 22.2%, which means that there is still a lot of variability left in the residuals.
When comparing BABIP with Ground Ball % (GB%), there seems to be no association. The P-value on the regression is 0.933 and the R-squared is 0%, so GB% does not seem to have any general effect on BABIP.

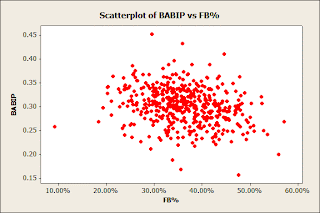
Finally, I looked at Fly Ball % (FB%) versus BABIP. Here there is definitely a negative association, which is confirmed by a 0.00 P-value in the regression test. The R-squared value is only 5.8%, though, and the association is not near the strength of LD% and BABIP, so in order to keep this simple I'm just going to look at those two variables for the rest of the analysis.

Next, I found the players whose BABIP in 2008 was furthest from the prediction based on their LD%; in other words, I looked for the largest residuals in the regression of BABIP against LD%. In order to make the residuals easier to deal with, I standardized them, and then looked for any greater than 2 or less than negative 2 (so, any residuals more than 2 standard deviations from the mean). A standardized residual over 2 means that the player's BABIP was much better than expected based on their LD%, and a standardized residual under -2 the opposite.
Greater than 2:
1. Felipe Lopez 4.36
2. Chris Dickerson 3.38
3. Jason Bay 2.69
4. Rafael Furcal 2.39
5. Nelson Cruz 2.25
6. Fred Lewis 2.14
7. Jeff Larish 2.14
8. Milton Bradley 2.06
9. Manny Ramirez 2.05
Less than -2:
1. Mark Sweeney -3.32
2. Andy LaRoche -3.26
3. J.R. Towles -2.97
4. Argenis Reyes -2.58
5. Michael Barrett -2.49
6. Jim Edmonds -2.42
7. Travis Hafner -2.33
8. Josh Bard -2.33
9. Nick Johnson -2.29
10. Kenji Johjima -2.17
11. Jason LaRue -2.12
12. Kory Casto -2.12
13. Eric Byrnes -2.03
However, after looking more carefully at the players on these two lists, only a couple show up as real outliers. To start, although I made the cut off 100 plate appearances in order to have enough data points, that's not really a large enough sample to analyze an individual player. Therefore, many of these high residuals can be chalked up to sample size. In fact, 19 of the 22 players did not really have a sufficient number of plate appearances, whether because of injury, not being a starter, or playing for two teams during the season. The high number of players with a small amount of plate appearances demonstrates the fact that there is more variability in the LD%-BABIP association when the sample size is smaller.
The three players left with a sufficent number of plate appearances are Milton Bradley, Fred Lewis, and Kenji Johjima. Bradley's LD% in 2008 was 24.7, which predicts a BABIP of .326, well under the .396 he posted last year. More evidence in favor of 2008 being a fluke is that his BABIP and LD% were both well over his career averages. Therefore, expect a decrease in production in 2009 for Bradley. Lewis's LD% of 18.4 predicts a .294 BABIP, but his BABIP was actually .367. Of course, Lewis is a speedy player and his high GB% give him a natural advantage in BABIP, but how much is not exactly clear (that's actually something I'd like to study if I could get the data). Therefore, it's safe to say he'll probably see some drop in production this year. Finally, Johjima's 21.1 LD% predicted a .307 BABIP, but his was only .233. Much of Johjima's disappointing 2008 can be pinned on this low BABIP. His ball-in-play percentages stayed pretty similar to his first 2 seasons, yet his BABIP dropped 60 points. Look for Johjima to have a bounce-back year in 2009.


I'm pleasantly surprised how interesting this post actually ended up being. And I love how you took advantage of the fact that you have a PC to utilize Minitab in creating those wonderful graphs, which i might add were a perfect visual to complement what you wrote. I'm really bored.
ReplyDeleteI like the new site design btw
ReplyDeleteYeah Minitab was quite useful for this little project. I think Excel might be able to do that stuff too but Minitab is way easier to use.
ReplyDeleteThis comment has been removed by the author.
ReplyDeleteless than 2% of these words are in my vocabulary
ReplyDelete